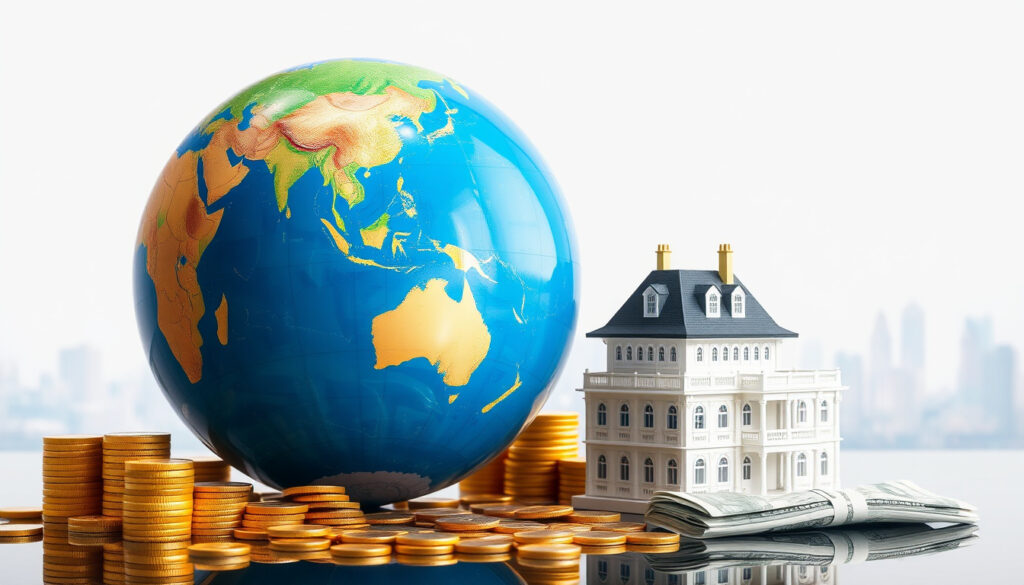
Richest Country in the World 2026: GDP vs Per Capita vs Wealth
Few questions spark as much debate as “which is the richest country in the world?” because the answer shifts depending on how you measure wealth. By total GDP, the United States leads with a projected $32.38 trillion in 2026, but by GDP per capita, tiny Luxembourg takes the crown. This article compares three different metrics to show why the richest country depends on the lens you use.
Richest Country by Total GDP (2026): United States: $32.38 trillion ·
Richest Country by GDP Per Capita: Luxembourg: ~$140,000 ·
Highest Mean Wealth Per Adult (2024): Switzerland: ~$700,000 ·
Projected Global GDP Growth (2026): 3.3% (IMF)
Quick snapshot
- United States has the highest nominal GDP globally (IMF World Economic Outlook (tier‑1 data))
- Luxembourg has the highest GDP per capita (~$140,000) (World Population Review (tier‑2 compilation))
- Switzerland has the highest mean wealth per adult in 2024 (UBS Global Wealth Report (tier‑1 bank))
- 2026 GDP figures are projections, not finalised (IMF (tier‑1))
- Ireland’s GDP per capita is distorted by multinational profits, making true wealth debatable (World Population Review (tier‑2))
- Relative rankings shift with exchange rates and inflation (Worldometer (tier‑2))
- 2024: UBS Global Wealth Report ranks Switzerland #1 by mean wealth per adult (UBS)
- 2026: IMF projects US total GDP at $32.38 trillion, China at $20.85 trillion (IMF)
- 2026: Visual Capitalist ranks richest by GDP per capita; Ireland and Luxembourg lead (World Population Review)
- Watch for final IMF 2026 data releases (IMF)
- Follow UBS 2025 Global Wealth Report for updated wealth per adult (UBS)
- Monitor exchange-rate shifts that affect per‑capita rankings (Worldometer)
Four key metrics, one pattern: the “richest country” label changes completely depending on whether you look at total output, per‑person output, or household wealth.
| Metric | Top Country | Value | Source |
|---|---|---|---|
| Nominal GDP (2026) | United States | $32.38 trillion | IMF (tier‑1) |
| GDP per capita (2025‑2026) | Luxembourg | ~$140,000 | World Population Review (tier‑2) |
| Mean wealth per adult (2024) | Switzerland | ~$700,000 | UBS (tier‑1) |
| Fastest growing large economy (2025) | India | ~6.5% | World Bank (tier‑1) |
Which country is the richest in the world in 2026?
Richest by total GDP (nominal)
When economists talk about the size of an economy, they usually look at nominal GDP. The IMF World Economic Outlook (tier‑1 projection) places the United States at $32.38 trillion in 2026, followed by China at $20.85 trillion and Germany at $5.45 trillion. Total GDP reflects the entire economic output of a country—its factories, services, jobs, and trade.
The implication: the US remains the world’s single largest economy by a wide margin, but its per‑person output tells a different story.
Richest by GDP per capita
Divide that total by the number of people and you get GDP per capita. According to World Population Review (tier‑2 compilation), Luxembourg leads with roughly $140,000 per person in 2025–2026. Ireland, Switzerland, Singapore, and Norway also rank above $100,000. These small, high‑productivity economies show that high output per person is possible even when the country is tiny.
The catch: GDP per capita says nothing about how that output is distributed or whether it reflects real domestic productivity versus corporate tax planning.
Richest by wealth per adult
Wealth per adult measures private household assets minus debts. The UBS Global Wealth Report (tier‑1 bank survey) ranks Switzerland first in 2024 with mean wealth per adult of just over $700,000. Luxembourg and the United States follow. This metric captures the accumulated prosperity of ordinary households, not just annual income.
Switzerland’s lead in wealth per adult shows that a country can be “richest” in household assets even if its GDP per capita is not the highest. For a Swiss saver, the annual UBS report is a direct measure of personal financial health.
Switzerland’s lead in wealth per adult shows that the “richest country” label is not one-size-fits-all.
Is the USA the richest country in the world?
How the US compares in total GDP
Yes, by total nominal GDP the United States is unambiguously first. IMF data shows the US economy is larger than the combined economies of Japan, Germany, and the UK. No other country comes close in absolute size.
How the US ranks by GDP per capita
Here the US falls behind. With a per‑capita GDP of roughly $80,000, it trails Luxembourg (~$140,000), Ireland (~$115,000), and Switzerland (~$100,000) according to World Population Review. The US is still in the top 10, but it is not the leader.
How the US compares to Europe
The US economy is larger than all European Union countries combined. IMF 2026 projections put the EU‑27 total at about $19.5 trillion, while the US alone stands at $32.38 trillion.
But on a per‑person basis, several European micro‑states and small open economies outrank the US.
“richest” depends on whether you ask “which economy has the most output?” or “which country’s average person is most prosperous?” Both are valid questions with different answers.
The US and European nations offer different forms of prosperity.
Is Ireland the richest country?
Ireland’s high GDP per capita explained
Ireland regularly appears near the top of GDP‑per‑capita rankings. According to World Population Review, its 2026 per‑capita GDP is around $115,000. But this number is inflated by the presence of multinational corporations that book profits in Ireland for tax purposes. The Wikipedia (tier‑2 editorial summary) notes that Ireland’s GDP figures are distorted by “transfer pricing” and corporate inversions, meaning the true income of Irish residents is lower than the headline number suggests.
Ireland vs United Kingdom economy
Ireland’s GDP per capita is more than double the UK’s (~$50,000) according to World Population Review. However, the UK’s total economy is about 13 times larger. The per‑capita gap is driven almost entirely by multinational profits booked in Ireland, not by higher wages for the average Irish worker.
Ireland’s high per‑capita ranking is a statistical artifact of tax policy, not a reflection of unusually high living standards for the majority of its population.
Ireland’s economic profile is shaped more by corporate tax strategy than by resident prosperity.
Ireland vs India wealth comparison
India’s total GDP (~$4.27 trillion in 2026) is far larger than Ireland’s (~$600 billion), but India’s per‑capita GDP is around $2,900. Worldometer shows that India ranks lower on a per‑person basis.
By any wealth metric, Ireland’s average citizen is much richer than India’s average citizen, though India’s economic size is growing quickly.
Ireland’s high per‑capita ranking is a statistical artifact of tax policy, not a reflection of unusually high living standards for the majority of its population.
The contrast illustrates how total GDP and per‑capita wealth can diverge sharply.
Who is the top 10 richest country?
Top 10 by total GDP (2026)
Based on IMF projections, the ten largest economies in 2026 are:
- 1. United States – $32.38 trillion
- 2. China – $20.85 trillion
- 3. Germany – $5.45 trillion
- 4. Japan – $4.38 trillion
- 5. India – $4.27 trillion
- 6. United Kingdom – $3.69 trillion
- 7. France – $3.29 trillion
- 8. Italy – $2.44 trillion
- 9. Canada – $2.29 trillion
- 10. Brazil – $2.20 trillion
These rankings follow the typical IMF order. The US and China alone account for over half of global GDP.
Top 10 by GDP per capita
According to World Population Review and Worldometer, the highest per‑capita economies in 2026 are:
- 1. Luxembourg – ~$140,000
- 2. Singapore – ~$130,000
- 3. Ireland – ~$115,000
- 4. Qatar – ~$110,000
- 5. UAE – ~$100,000
- 6. Switzerland – ~$100,000
- 7. Norway – ~$95,000
- 8. United States – ~$80,000
- 9. Brunei – ~$75,000
- 10. San Marino – ~$70,000
Note that Liechtenstein and Monaco often top these lists but are omitted from some compilations due to dataset coverage issues (World Population Review).
The pattern: small, high‑income economies dominate the per‑capita table, while large land‑mass economies dominate the total‑GDP table.
Who is world no. 1 rich?
Richest individual vs richest country
As of 2025, the world’s richest individual is Bernard Arnault, according to Forbes (tier‑2 billionaire tracker). His net worth of around $220 billion is larger than the GDP of many small countries. But the richest country is a different question – it depends on the metric you choose.
Richest country by different metrics
To sum up the three main lenses:
- Total GDP: United States ($32.38 trillion) – the largest economy.
- GDP per capita: Luxembourg (~$140,000) – the highest output per person.
- Wealth per adult: Switzerland (~$700,000) – the most household wealth per person.
Each metric tells a different story about what “richest” means. For a global investor, the US remains the most important market. For a worker seeking high wages, Luxembourg or Switzerland offer the highest pay. For a family looking to build net worth, Switzerland’s wealth environment is unmatched.
No single country is “the richest” in every sense. The answer depends entirely on the question you ask. For a policymaker, total GDP matters. For a citizen, wealth per adult or per‑capita GDP matters more. The metric you choose shapes the conclusion.
The choice of metric is not academic; it shapes where you invest, where you work, and where you build your life.
Timeline
- 2024: UBS Global Wealth Report ranks Switzerland #1 by mean wealth per adult (UBS).
- 2025: GFMag publishes richest countries list with 2025 data (World Population Review).
- 2026: IMF projects US total GDP at $32.38 trillion, China at $20.85 trillion (IMF).
- 2026: Visual Capitalist ranks richest by GDP per capita; Ireland and Luxembourg lead (World Population Review).
Clarity
Confirmed facts
- United States has the highest nominal GDP as of 2024–2026 (IMF).
- Luxembourg has the highest GDP per capita (~$140,000) (World Population Review).
- Switzerland has the highest mean wealth per adult (2024) (UBS).
What’s unclear
- 2026 GDP figures are projections, not finalized (IMF).
- Ireland’s GDP per capita is distorted by multinational profits, making true wealth debatable (World Population Review).
- Relative rankings shift with exchange rates and inflation (Worldometer).
Quotes
Switzerland leads in mean wealth per adult, with a figure of just over $685,000 in 2024.
— UBS Global Wealth Report 2024 (tier‑1 bank survey)
The US GDP projection of $32.38 trillion for 2026 reflects the country’s dominant position in the world economy.
— IMF World Economic Outlook (April 2026) (tier‑1 institution)
Ireland’s GDP per capita ranking is inflated by the presence of multinational corporations that book profits in Ireland for tax purposes.
— World Population Review (tier‑2 editorial summary)
Summary
The question “richest country in the world” has no single answer – it depends on whether you measure total economic output, per‑person output, or household wealth. For a global investor, the United States remains the largest market. For a worker seeking high wages, Luxembourg or Switzerland offer the highest pay. For a family looking to build net worth, Switzerland’s wealth environment is unmatched. The choice of metric is not academic; it shapes where you invest, where you work, and where you build your life.
unioncitizenship.com, worldpopulationreview.com, imf.org, en.wikipedia.org, imf.org, worldpopulationreview.com, dailyhive.com, imf.org, statisticstimes.com
Frequently asked questions
What is the richest country in the world by GDP?
The United States is the richest by total nominal GDP, with a projected $32.38 trillion in 2026, according to the IMF.
Which country has the highest GDP per capita?
Luxembourg has the highest GDP per capita, around $140,000 per person in 2025–2026, based on World Population Review data.
Why is Luxembourg considered the richest country?
Luxembourg’s small population and high‑productivity financial sector produce an exceptionally high GDP per capita, making it the richest by that measure.
Will the USA remain the richest country in 2030?
Most projections, including the IMF’s, show the US maintaining the largest total GDP through 2030, but per‑capita rankings may shift as other economies grow faster.
What does GDP per capita tell us about wealth?
GDP per capita divides total output by population, giving an average income per person, but it does not measure inequality or household assets.
How does Switzerland measure wealth per adult?
Switzerland’s mean wealth per adult is calculated by the UBS Global Wealth Report, dividing total private household net worth by the number of adults.
Is China the richest country in the world?
China is the second‑largest economy by total GDP ($20.85 trillion in 2026), but its GDP per capita and wealth per adult are far lower than those of the US, Luxembourg, and Switzerland.
For a New Zealand reader comparing global economies, the true size of countries is worth understanding – and currency conversions like 10,000 USD to NZD help put those dollar figures into perspective.
More related posts
 My Food Bag NZ: Pricing, Menu & Cancellation Guide
 Gamefallout.com Author Jeffery Williams: Verified Facts
 Ivermectin Dosage for Humans: Weight, 12 mg, How to Take
 New Plymouth to Taupo: Best Routes, Stops & Travel Guide
 Ziwi Peak Dog Food: Facts on Cost, Safety & Ownership
 CCT Lavender Farm Cafe Opening Hours, Menu & Visitor Guide
 Flights from Auckland to Perth – Direct Schedules, Airlines & Prices
 Bane of My Existence: Meaning, Origin & Bridgerton Connection